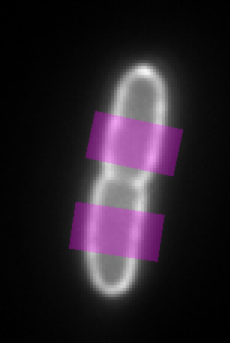
Fig. 1 Evaluation areas across the cell
Go back to ObjectJ Examples
Norbert Vischer
18-Feb-2019
This macro is intended for cells that have already been analyzed with Coli-Inspector.
(See also the CrossProfiles.ojj project for manual marking)
It qualitatively analyses the ratio between membrane- vs. cytoplasm location of fluorescent proteins by creating intensity profiles perpendicuar to the cell axes.
Choose ImageJ>File>Open.., and open the CrossProfileMacro1.x.txt
Choose menu Macros>Run Macro
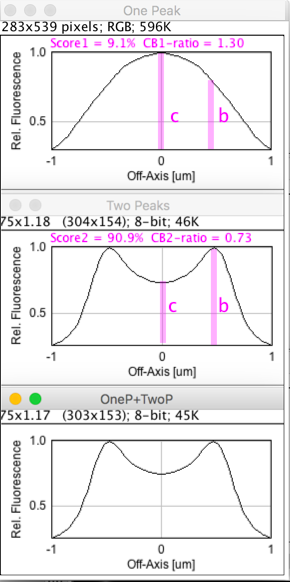
After execution, three profile plots are created:
When you definitely expect a 2-peak profile , take the data from the Two-Peak profile (column CB2-Ratio) which is not spoilt by mainly artefacts that created one peak.
Make sure to use the newest versions of ImageJ and ObjectJ.

Fig. 1 Evaluation areas across the cell

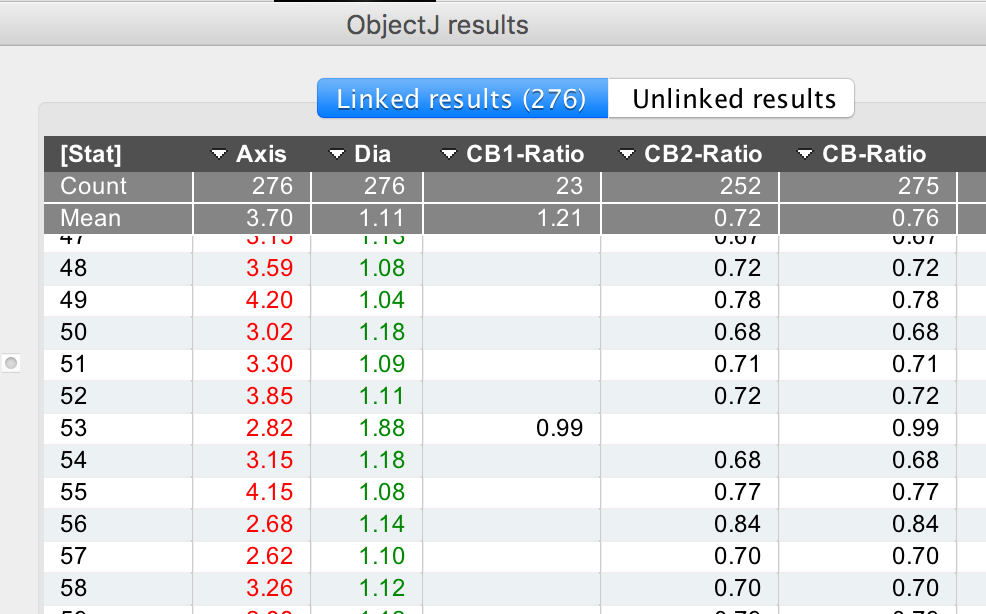
Fig. 2 Linked Results show CB1-Ratio, CB2Ratio, and CB-Ratio

Fig. 3 Three collective plots of all profiles