CrossProfile Analysis
Norbert Vischer, 16-Nov-2017

Measurement of cross-profiles of bacterial filaments
Move CrossProfiles.ojj into the folder "Demo Images"
Open CrossProfiles.ojj by dragging it into the ImageJ main window
Open one of the linked images, and select channel 2
Choose Line tool and draw a line across a filament.
Choose ObjectJ>Line Roi to Object [1] (or press key 1)
(green line object will be drawn in channel 2)
Linewidth will be adjusted (currently: 20 pixels).
The line tool will be re-activated
Continue to set more lines on more linked images
Choose ObjectJ>Save Project to save your measurements
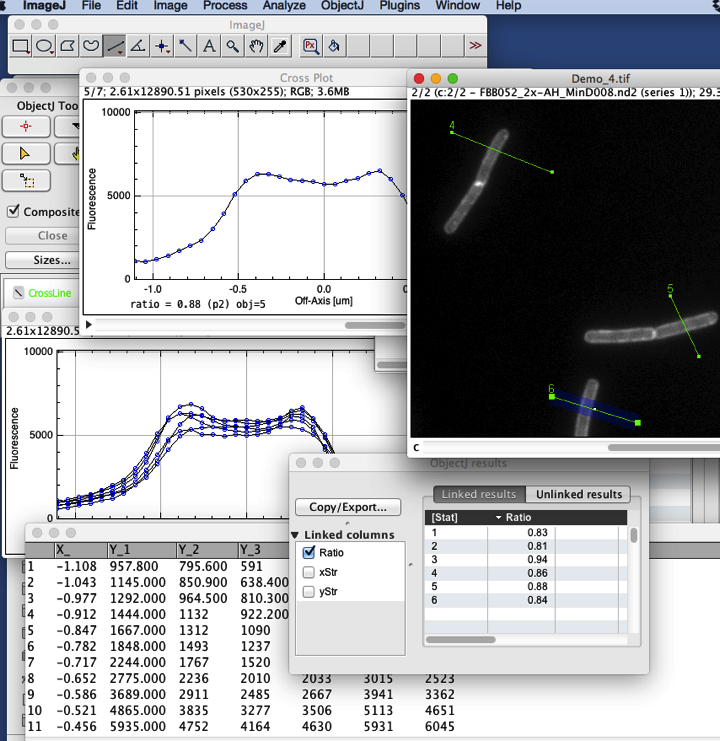
Choose ObjectJ> Analyze Profiles this will create a stack of plots, with one extra plot with superimposition of all. Also the numerical results are calculated.
Plots are automatically centered so the cell axis is at x = 0
The length and symmetry of the marked lines does not matter, but the line must be long enough so that the macro is able to detect the correct plot section which is 35 pixels wide (2.2 um), and the line should cover background for correct background subtraction (we subtract the lowest value of the line).
Ratio is shown at the bottom of each plot, and in ObjectJ>Show ObjectJ Results.
Ratio a/b is calculated in two different ways, depending on the number of peaks:
1 peak: a = value at center, b = mean of off-center values (at center - 0.26 um and center + 0.26 um)
2 peaks: a= valley, b= mean of two peak heights
If images contain 3 channels, then profiles are made from channel 2 and 3, showing 2 collective plot windows. ObjectJ Results will then show columns Ratio2 and Ratio3.
You also can export the individual profiles as raw data via ObjectJ>Export.