Download
ChainTracer Video (4:50 min, 11 MB, with sound)
28-Jun-2016
History
Download
![]()
ChainTracer Video (4:50 min, 11 MB, with sound)
ChainTracer is a project that analyses multi-channel images of chain-forming bacteria.
It runs in combination with ImageJ and the ObjectJ plugin.
For cases where cells are too crowded, look for NucTracer
Norbert Vischer
Bacterial Cell Biology
University of Amsterdam
Features
Syvertsson S, Vischer NOE, Gao Y, Hamoen LW (2016) :
When Phase Contrast Fails: ChainTracer and NucTracer, Two ImageJ Methods for Semi-Automated Single Cell Analysis Using Membrane or DNA Staining
PLoS ONE
If not done yet, install ImageJ from: http://imagej.nih.gov/ij/
If the ObjectJ plugin is already visible under menu Plugins, jump to (4).
Otherwise, you can install ObjectJ as follows:
Download objectj_.jar from
https://sils.fnwi.uva.nl/bcb/objectj/download/current/
Make sure objectj_.jar was not renamed (because an older version already existed in the download folder).
Drag objectj_.jar onto ImageJ's main window (which contains the tools).
Confirm when ImageJ asks to store this plugin in the plugins folder, and relaunch ImageJ.
You can choose Plugins> ObjectJ to make the ObjectJ menu visible (see fig 2),
but the ObjectJ menu will appear anyway the first time you open an .ojj project file.
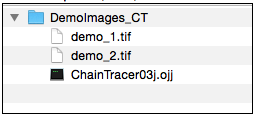
Download and unpack the folder 'DemoImages_CT', which contains two hyperstacks. We will use it as our 'project folder'.
Download and unpack the project file 'ChainTracer-xx.ojj' and store it in your local project folder where the demo images are.
In order to open ChainTracer-xx.ojj, you can either drag its file icon from the Finder/Explorer into the main window with title "ImageJ", or you can use ImageJ's Open menu.
If the ObjectJ menu (between Analyze and Plugins, Fig 2) was not visible yet, it should appear now.
Now the project window is shown, with the panel for linked images still being empty.
In order to link the two files demo_1.tif and demo_2.tif, go to the Finder/Explorer and drag their icons into "Linked Images" panel (Fig 2). Alternatively, you can link images via menu ObjectJ>Linked Images.
The two green bullets confirm that the image files are in the same folder as the project.
The hyperstacks used here contain several channels and frames. Channel 1 (gray) is used for phase contrast, channel 2 (cyan) for membrane staining, and channel 3 (green) for GFP.
Now you can start with the analysis, using the embedded macro commands under ObjectJ menu.
Choose ObjectJ> Mark Filaments. This is the first embedded macro.
It measures and marks all phase contrast images contained in the two hyperstacks, and indicates where criteria are not met in case of rejection (Fig 3)
Choose ObjectJ> Make Straight Cells
All marked cell chains are arranged in a single hyperstack called "StraightCells.tif" and saved in the project folder. Chain number labels are shown as non-destrucitive overlay, that is visible in all three channels.
Choose ObjectJ> Find All Septa
In "Straight Cells", Channel 2 is evaluated to detect septa. These are marked as non-destructive red triangles.
Manually add or delete septum markers
You can add more septa manually by locating the cursor at the desired position in "Straight Cells" and then press key "A". This is the shortcut for macro ObjectJ> Add Septum. A manually added septum is marked with a yellow triangle.
Similarly, you can delete a septum with the key "D" (macro ObjectJ> Delete Septum [D]).
You can dispay the intensity profile that is used to distignuish septa by placing the cursor upon a cell and press key "F" (macro Show Profile [F]).
Choose ObjectJ> Resolve Cells from Chains to mark individual cells. A cell is characterized by a cell axis (segmented line, only vertices are visible as dots), and a cell box that uses the diameter of the cell chain.
Choose ObjectJ> Calc Diameters via Membrane to set markers that indicate the cell diameter as derived from the membrane stain. For marking, a line object is used, but only the end points are visible as dark purple dots.
Choose ObjectJ> Calc GFP Segments to output the desired fluorescence values per cell. For this measurement, the cell box is applied to the GFP channel to calculate integrated fluorescence.
Choose ObjectJ> Save Project to save the project.

Fig 1: Project file (ending with .ojj) and images need to be in same folder

Fig 2: Left: ObjectJ Tools indicates item types Axis, Dia, and Septum that are used for marking.
Right: 'Linked Images' panel of project window shows that two stacks (demo_1.tif and demo_2.tif) are linked. Green bullets indicate that the files are in the correct folder.

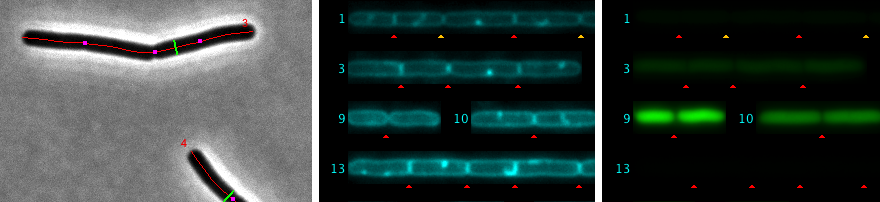
Fig 3: Automatic marking of cell chain axis (red) and diameter (green). Rejected cells are temporarily labeled in yellow.

Fig 4: Straightened cell chains are arranged as 3-channel hyperstack. This file is saved in the project folder.

Fig 5: Septa are marked automatically with red triangles. In chain #1, four yellow triangles were added manually. Also, some red triangles (false positives) were removed manually.

Fig 6: Locating the cursor on cell chain #1 and pressing key "F" shows its intensity profile with marked peaks. Small horizontal magenta lines indicate the noise level used to separate peaks. Some peaks on the right were manually unmarked.

Fig 7: Cell outlines as derived from the phase contrast image can be shown in other channels via command ObjectJ Show / Hide Outlines.

Fig 8: ObjectJ> Marking Chains and Cells Chain is marked with red axis line and green diameter. By choosing 'Resolve Chains to Cells", additional cell objects are marked(magenta: cell box, yellow dots: cell axis, purple dots: diameter of membrane cylinder)

Fig 9
: ObjectJ> Show ObjectJ Results shows linked results. Objects of type 'Chain' and type 'Cell' can co-exist in one table, as they occupy different columns. For example, object #81 is a cell and object #82 is a chain.
This project has embedded macros, whose titles appear indented under the ObjectJ menu. Via ObjectJ> Show Embedded Macros, they are commented in more detail, can be edited, or the user can sigle-step through the program and observe variables with ImageJ's macro debugger.
Mark Filaments
Marks chain axis and mean diameter of the cell chain. Marking takes place in phase contrast channel of all linked images. Reasons for rejected cells are temporarily shown as orange text overlay.
The ObjectJ results table is automatically populated with corresponding values (e.g. Axis = 20 um, Dia = 0.9 um).
Make Straight Cells
All marked chains are straightened and arranged in a single hyperstack called "StraightCells.tif", which is saved in the project folder. Cell number labels are shown as non-destrucitive overlay, that is visible in all three channels.
Show Straight Cells
Opens StraightCells.tif from the project folder, or brings it to the front if it was open.
Find All Septa
Septa are marked automatically in "Straight Cells" with red triangles by evaluating profiles in channel 2 (Membrane stain). Positions of septa are stored in the project file.
Add Septum [A]
This macro can only be used via the shortcut key "A". It adds a yellow triangle at the cursor position.
Delete Septum [D]
This macro can only be used via the shortcut key "D". It deletes the triangle under the cursor position.
Delete Cells or Chains..
Deleting cells may be useful when you want to go back and edit septum positions, and then resolve cells from chains again. Deleting chains may be useful to simplify the ObjectJ results table, when chain information is not needed anymore.
Rebuild Overlay
Reads the septa positions from the project file and re-paints red or yellow triangles into "Straight Cells".
Select Back-Forth [S]
This macro can only be used via the shortcut key "S". If StraightCells is in front, the evaluation rectangle under the cursor is displayed, and the correponding object is highlighted in both the original stack and in the ObjectJ results table.
Similarly, if a hyperstack is in front with a selected cell or chain, its straightened version is brought to front.
Show Profile [F]
This macro can only be used via the shortcut key "F". It draws an intensity profile along the cell chain in the membrane channel. The peaks in the profile are highlighted in red (automatic) or yellow (manual).
Hide/Show Outlines [[F6]
Cell outlines as derived from the phase contrast image are be shown in the current channel.
Resolve Cells from Chains
Uses detected septa to create new cell objects with their own number labels. A cell object consist of a cell axis (segmented line), and a cell box.
Calc Diameters via Membrane
Loops through all cell objects and determines the diameter of the cylindrical part of the cell membrane. This is done by finding the maxima of membrane fluorescence using several perpenidcular profiles.
Calc GFP Segments
Uses the cell boxes to determine integrated fluorescence in the GFP channel.
Subtract Fluor. Backgrounds ..
From all linked fluorescent channels, backgrounds are calculated (as modal value of central 80% of width and height). With key Caps Lock down, the observer will see those pixels in red which would become zero after background subtraction. Before performing any subtraction, a table of calculated backgrouds is shown, with the option to edit the table or abort the process. The table is also copied to the clipboard, and if the user chooses File>New>System Clipboard, there are more options to edit than only to delete rows. However, the table columns may not be properly aligned.
| Column | Explanation |
|---|---|
| ChainAxis | Axis length of cell chain |
| ChainDia | Diameter of cell chain (calculated from area and axis length) |
| CellAxis | Length of individual cell |
| DiaP | Diameter of the cells parent chain |
| CellDiaM | Diameter of the cells membrane cylinder |
| GFPFluor | Integrated GFP fluorescence inside cell box (x0.001) |
| GFPMax | Max GFP fluorescence inside cell box |
| GFPMean | Mean GFP fluorescence inside cell box |
| GFPMid | Mean GFP fluorescence inside along the cell axis |
| ParentID | Negative ids for chains, positive ids identify a cell's parent |