25-Sep-2016
Norbert Vischer
Bacterial Cell Biology
University of Amsterdam
In Zebrafish embryos, the in vivo biocompatibility of microspheres is tested by analysing 4-channel hyperstacks with ImageJ and plugin ObjectJ.
The first channel is brightfield and shows the fish contour and the injection point, which is marked manually. In the fluorescence channels, the location and strength of the various immuno-reactions of the organism can be quantified.
Zebrafisch Immunotest Video (3:30 min, 7 MB, with sound)
If not done yet, install ImageJ from: http://imagej.nih.gov/ij/
If the ObjectJ plugin is already visible under menu Plugins, jump to (4).
Otherwise, you can install ObjectJ as follows:
Download objectj_.jar from
https://sils.fnwi.uva.nl/bcb/objectj/download/current/
Make sure objectj_.jar was not renamed (browsers may have the habit to add a suffix number if an older version already existed in the download folder).
Drag objectj_.jar onto ImageJ's main window (which contains the tools).
Confirm when ImageJ asks to store this plugin in the plugins folder, and relaunch ImageJ.
You can choose Plugins> ObjectJ to make the ObjectJ menu visible,
but the ObjectJ menu will appear anyway the first time you open an .ojj project file.

Fig 1:
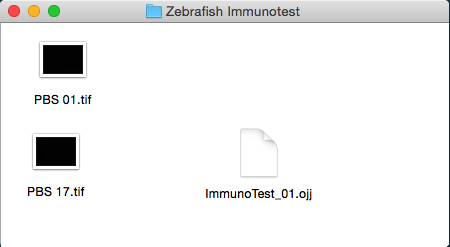
Project folder
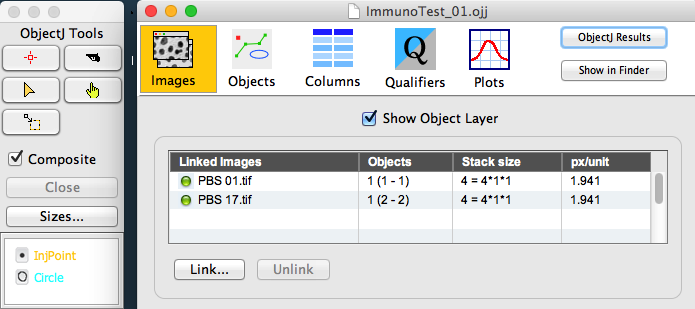
ImmunoTest_xx.ojj: project window becomes visible. The panel for "Images" is still emptyInjPoint for manual marking, and Circle for automatic markingContinue to mark all other linked images.
Choose ObjectJ > Save Project
The project file now contains image names and marker positions, but the images were not altered.

Fig 2: ObjectJ Tools (left) and Project Window
Choose ObjectJ> Calc Immuno Reaction
This will perform the following steps:
Any previous "Circle" markers will be deleted, i.e. cleaned up before being recreated.
Ch2 (GFP) of the stack will be temporarily blurred for detecting maxima
Largest maximum in neighborhood (within 50 um) will be assigned as center of inflammation, and marked in Ch2 with an evaluation circle with radius = 50 um.
Ch3 (m-Cherry) of the stack will be temporarily blurred for detecting maxima
The steps above are repeated for all linked images.
Data can be observed via ObjectJ> Show ObjectJ Results.
It shows the Integrated Fluorescence of the evaluation circles
Value = 0 means no maximum was found
Choose ObjectJ>Save Project to save the new markers and results
Choose ObjectJ>Show/Hide Neighborhood [F2] to show/hide the injection point as small square, and evaluated neighborhood as white circle
Choose ObjectJ>Change Channel View [F3] several times to step through different views: red, green, red+green
Choose Image>Adjust>Brightness/Contrast to show max contrast inside image or current roi.

Fig 3:
Screenshot of three channels:
left: bright-field with orange marker at injection point; white neighborhood circle was shown via shortcut [F2]
center: GFP channel (macrophages), evaluation circle is centered around largest peak
right: mCherry channel (neutrophils) with its evaluation circle

Fig 4:
Screenshot of ObjectJ results:

Fig 5: Adjustable parameters:
To change parameters, choose ObjectJ>Show Embedded Macros, change indicated in Fig 5, then click button Install in ObjectJ and choose : ObjectJ> Save Project
If you have single images, you can combine them to hyperstacks as follows:
//macro to arrange 4 individual images as Hyperstack
//in the order they appear under the Windows menu
//defining colors and slice labels:

macro "Four images to hyperstack"{
    if(nImages != 4) exit("exactly 4 images must be open");
    run("Images to Stack", "name=Stack333 title=[]");
    run("Stack to Hyperstack...", "channels=4 slices=1 frames=1");
    colors = split("Grays Green Red Blue");
    labels = split("BF Macrophages Neutrophils UV");
    for (chn = 1; chn <= 4; chn++){
        Stack.setChannel(chn);
        run(colors[chn-1]);
        setMetadata("label", labels[chn-1]);
    }
}