Fig 1:
Go back to ObjectJ Examples
14-nov-2019
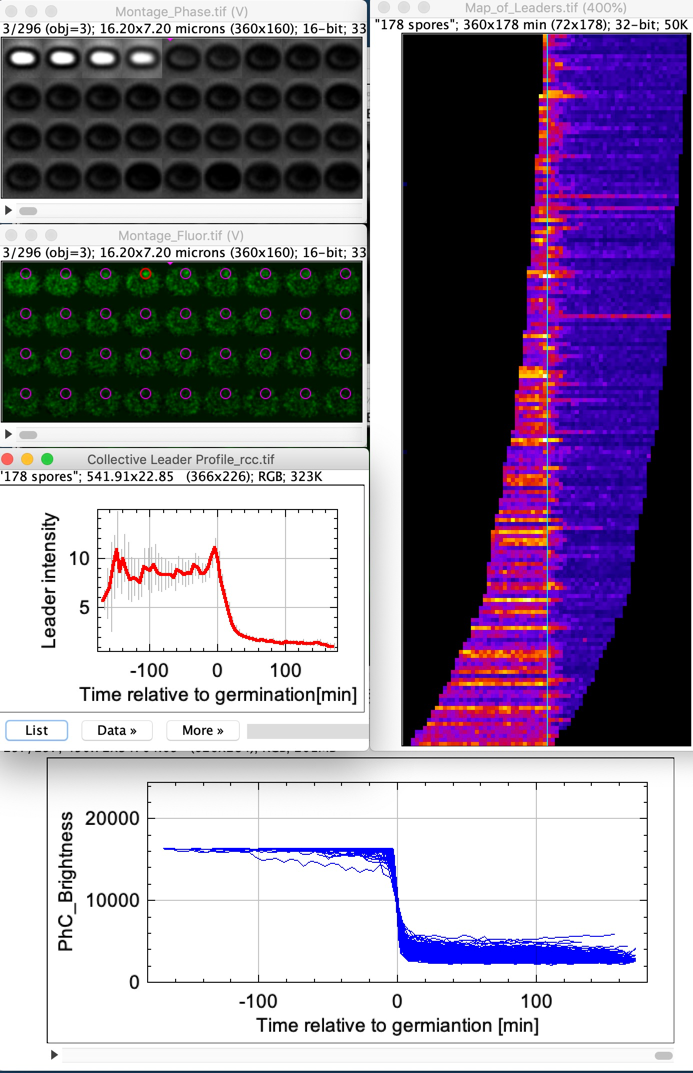
The germination of bacterial spores is analyzed in time, including the bright-to-dark transition(phase-contrast channel) and development of germinosomes (fluorescence channel). All movies linked to the project file are assumed to belong to the same population.
Fig 1:
Montage_Phase: Shows bright-to-dark transition (36 shapshots, interval = 5 min)
Montage_Fluor: Shows fluorescent germinosome in time, strongest spot is called "leader"
Phase_Plots: Stack of plots showing collective and individual phase profiles
Map-of-Leaders: Shows the fluorescence at the leader positions of the entire population during the entire time. Each leader profile is accommodated in one pixel row, sorted from early to late germination. The vertical cyan line is the time point of germination.
Collective Leader Profile: Vertical average-projection of the Map of Leaders
demo_movies)Here is a list of the relevant commands under ObjectJ menu. You can directly execute menu:
ObjectJ>Batch (all above)
which executes all commands above it serially and full-automatically, so you don't need to call those individually. Then choose one of the Plot, Map, Histogram or Navigate menu items
Map of Leaders
The Map of Leaders shows the fluorescence at the leader positions of the entire population during the entire time. Each leader profile is accommodated in one pixel row, rows are sorted for increasing germination time.
Non-germinating spores and weak leaders are ignored. The map is shown in false color for better contrast. The vertical cyan line is the time point of germination.
Additionally, a 'Collective Leader profile' is created,
line is the time point of germination.
Plot Leader Peaks (Three Plots)
Plot Fluorescence at Leader pos vs time
creates a stack of plots, each showing the intensity of the leader position vs time.
Histogram Germinations
Navigation: With one of the montages in front, navigate through all spores with the chosen "view type" (see below).
Navigate To:>
-- Previous Object [1]
-- Next Object [2]
-- Current Object [3]
-- Object #... [3]
Utils>
-- Selected Object as Table [T] For the selected object, the string in the (hidden) "Phase" or "Spots" column is shown as formatted table.
-- Arrange [F2] Arranges windows montage windows on the screen
-- Test S-Curve applies S-curve fitting to bright-to-dark transition(only for test)
Choose View Type [5]
This command has effect on how data are displayed when using navigation shortcuts - the do not affect the results. You also can create a stack of surface prots for the current object.
![]() Fig 2: Each row in ObjectJ Results is linked to one individual spore
Fig 2: Each row in ObjectJ Results is linked to one individual spore