|
SporeTracker Spore Germination and Growth Analysis Norbert Vischer vischer at science.uva.nl 14-Nov-2012 University of Amsterdam
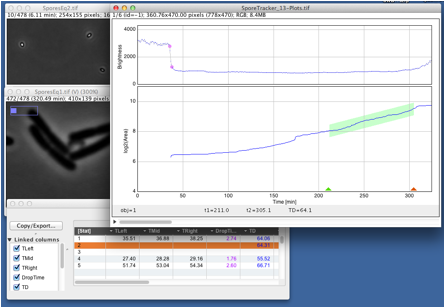
Fig 1: Dual plot versus time. Upper plot shows bright-to-dark transition with magenta circles at 90% and 10% of the drop range. Lower plot shows growth, whose evaluation window was set manually to 211 .. 305 min, and the light green band shows the result of linear regression curve fitting. This project analyses movies of spores that germinate and grow out to colonies. Features: - Dual plots for germination and growth - Collective analysis for spores shown on different movies - Plot can be used as navigation panel for playing back "interesting" parts - Manual timepoints can be set as "signs" (burst, evaluation window for growth). - Linked results include germination time, drop time, doubling time after first transition) Installation - Make sure objectj_.jar is downloaded into ImageJ's plugin folder - Launch ImageJ - Open SporeTracker.ojj (name may have a version suffix) ObjectJ menu will become visible.
ObjectJ menu macro commands: ObjectJ> Mark Spores In First Slice detects
bright spots in first slice and sets blue "Bright" markers.
Before marking, you will be asked to adjust threshold so that all bright
spots are thresholded (appearing as red particles). Then click “OK” to
continue. ObjectJ> Mark Dark Phase - creates a circular area (rad =
2 px) around each "Bright" marker and
evaluates "intenisty
vs. time".
ObjectJ>Measure Growth The program follows area from phase-dark
until the end of movie, or until the growing colony touches the edge or
another colony. Data are put into ch2 of SporeTracker-01-Map.tif, which
is saved in the project folder. ObjectJ> Show Collective Plots Shows
the plots stack, that is located in the project folder. In this example, its
name is "SporeTracker-01-Plots.tif". The stack contains as many plots as there are marked spores, plus one
extra collective plot at the end. These plots can be used as navigation
panels, so you can browse with the Naviagation tool "N"
and follow the image of the corresponding cell/colony in time. ObjectJ> Toggle VisRange Toggles
between showing markers only in their home slice, or showing markers always,
independent which slice is active. ObjectJ> Set Burst Sign [F4] To set a "Burst" sign, position the mouse cursor above the time axis and hit the F4 key. A triangle will be painted into the plot window and the corresponding time point is entered in the results column "tBurst". If the cursor was positionded below the time line, any "Burst" sign is removed. We used the "Burst" sign to mark the sudden increase of area after germination. ObjectJ> Set Start Sign [F5] To set a "Start" sign, position the mouse cursor above the time axis in the plot window and hit the F5 key. A triangle will be painted into the plot window and the corresponding time point is entered in the results column "t1". If the cursor was positioned below the time line, any "Start" sign is removed. The start sign is used for defining the left border of the time window that is used for evaluating the doubling time TD. We were setting the start sign at tDiv, which is the time where the cell started its first division. ObjectJ> Set Stop Sign [F6] Similar to "Start" sign, for defining the right border of the time window used for evaluating the doubling time TD. ObjectJ> Fit Growth Plots Performs linear regression curve fit
inside the evaluation time window. If no "Start" sign
was set, the evaluation window will be set automatically: it detects the
straight end of the plot that conforms to the desired fit quality (default:
R^2=0.99). Set R^2 to 0 or 1 to
disable automatic detection. Columns in ObjectJ results: DarkTime: time (in
minutes) when the grayvalue drops below the TLeft: time (in minutes) when the gray value reaches 90% of drop range TMid: middle between TLeft and TRight TRight: time (in minutes) when the gray value reaches 10% of drop range DropTime: drop time (in minutes) elapsed during 90% to 10% of drop range TD: doubling time (in minutes) calculated from the evaluation time window tBurst: time
where the user set a Burst sign t1: where
theuser set a startpoint for curve fitting (we set
this sign to the time point of
first cell division, tdiv) t2: endpoint for curve fitting |