Norbert Vischer, Côme Denechaud, Anders Thorsen
02-jan-2024 version 1.13

(You can install ObjectJ by dragging objectj_.jar onto the ImageJ main window and then confirm to store it in ImageJ's plugins directory)
For trying out, a folder with two demo otolith images is available
Put a copy of Otoliths_xx.ojj into the folder that contains the images to be annotated
Open Otoliths_xx.ojj by dragging it into the ImageJ main window
ObjectJ menu becomes visible
Link the images to be measured by dragging them into the panel for Linked Images
Open the first image by double-clicking its name in the panel for linked images
ObjectJ menu contains four embedded macro commands at the bottom:
Choose ObjectJ>Start Sequence [F1]
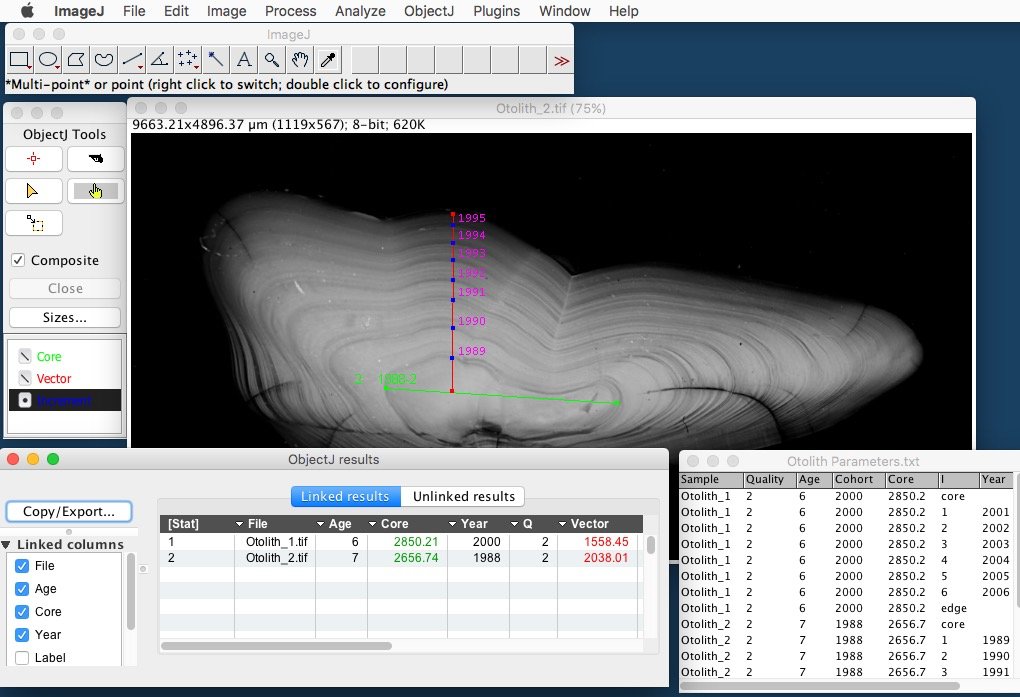
In ObjectJ Tools, "Core" is selected and cursor becomes green
Mark the green Core line
In ObjectJ Tools, "Vector" is automatically selected and cursor becomes red
Mark the red Vector line
In ObjectJ Tools, "Increment" is automatically selected and cursor becomes blue
Mark the increments (in any order). Press key Backspace to delete the last point
Finish the sequence by choosing ObjectJ>Year and Quality...[F2]
Enter the start year as positive number, or the end year as negative number
The sequence is now complete. Optionally, choose ObjectJ>Show/Hide Year Annotation
The annotation is a temporary ImageJ overlay which needs not to be saved
Continue to measure more otoliths
Choose ObjectJ>Save project which updates the .ojj project file.
Choose ObjectJ>Show ObjectJ Results to observe the results
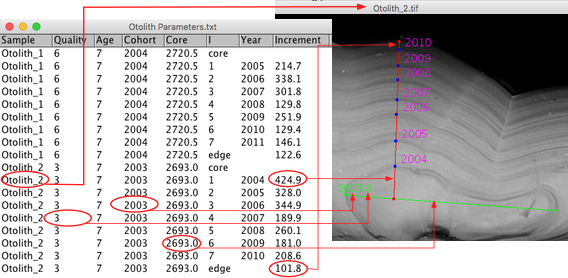
Choose ObjectJ>Create Output Table for specially formatted output. When saved with .csv or .tsv extension (comma-separated or tab-separated values), ImageJ will recognize it later as table.
.ojj project file. The year numbers are not saved as overlay - they are re-built when needed.Similarly, you can delete an entire object with the pistol tool, or keep key "alt" key down to delete a point only.
Adding "Increment" points later:
a) Optionally choose in ObjectJ Tools> Sizes> 'Show Object Number' = yes.
b) From ObjectJ Tools, choose the "Finger" tool, and first click somewhere away from marked points to make sure no object is selected (marker points appear non-fat)
c) then double-click any marked point of an unselected object. Now, that object is "open", showing label in italic and with asterisks: e.g. in case of Object #17, the "Core" item will be labeled as *17*.
d) Then, from ObjectJ Tools, select "Increment" and add more blue points. Choose either ObjectJ>Year and Quality... or ObjectJ>Create Output Table to snap points to the vector and update results.
When choosing ObjectJ>Create Output Table, the blue "Increment" points will be arranged in the correct order and snap onto the red Vector line before the table is created.
You also can change the scaling of linked .tif or .jpg images: choose ObjectJ>Show Project Window> Images and right-click and change any field in column "px/unit". Results will be updated.
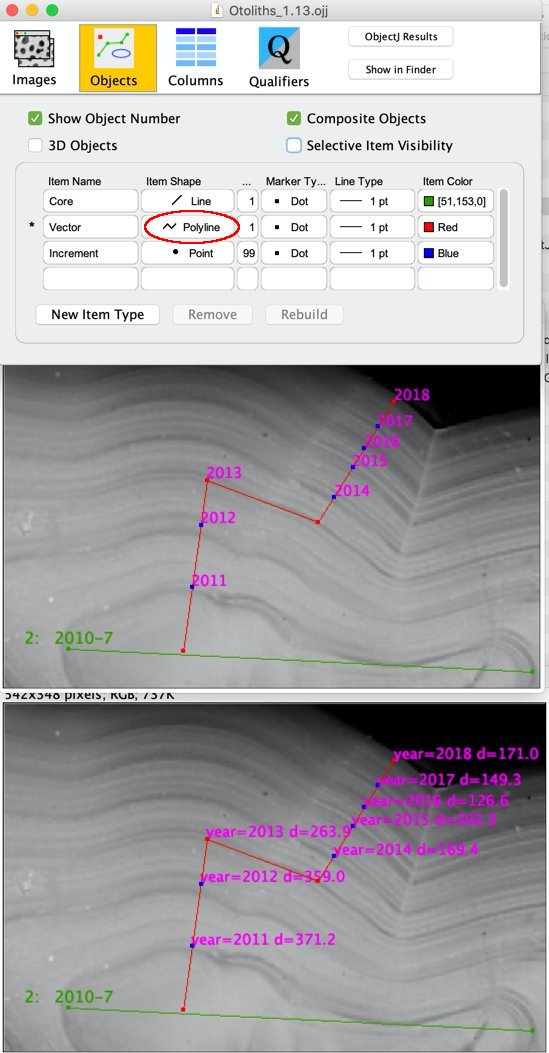
In previous versions, the red "Vector" was a single straight line. From version 1.13, you can use a segmented line: before starting, choose ObjectJ>Show Project Window and select the Objects panel. For Item "Vector", choose Item Shape = Polyline, and optionally choose ObjectJ>Save Project. For example, after marking the core, create a "vector" with 1, 3 or 5 segments, then press the tab key to switch to itemtype "Increment", or click "Increment" in ObjectJ Tools to continue with marking points.
Note that the "Vector" column in ObjectJ>Show ObjectJ Results shows the polyline's entire length.
Another improvement is the menu ObjectJ>Show/Hide Annotations (long) (see screenshot bottom part).

Here, object #2 started at year=2010 with quality=7, but from year 2013 we chose to mark rings along a different line segment. ObjectJ>Show/Hide Annotations (long) (screenshot bottom) can be used to verify any distance d with ImageJ's line tool, which shows its length in the status bar.
__
by Côme Denechaud