Sporulation project
This ImageJ/ObjectJ project analyses spore formation of bacterial filaments.
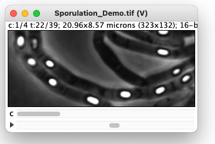
The download folder contains a timelapse series (10 spores shown in 4 channels, 39 frames). Phase-bright sprores are detected in the last frame, and then are followed backwards in time to detect the timepoint of sporulation. Behaviour of fluorescence with respect to sporulation is visualized in “Maps”, plots and numerical output, so the user can study the development of any single spore in time. The time point of sporulation is detected automatically, but can be overriden by the user after inspection.
This project runs in ImageJ in combination with plugin ObjectJ. Macro commands that are specific to this project appear under the ObjectJ menu and are explained below.
Macros ObjectJ menu:
ObjectJ>Mark Spores
Shows last frame of chn 1 (PhC),, with suggested thresholding
- adjust Threshold if necessary
- in spores will be marked in last frame, then in preceding frames
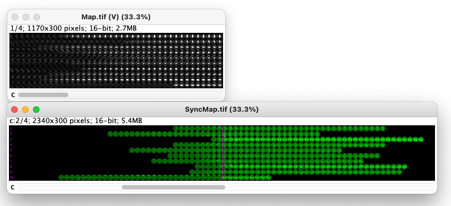
ObjectJ> Create Maps
Our demo file has 39 frames, and 10 objects (spores) were followed.
This command creates a matrix of (horizontal * vertical) 39 frames * 10 spore objects.
Additionally, a “SyncMap.tif” is created, which is twice as wide (78 frames) , and the horizontal center is defined to be i.e. t= 0, i.e the time point of sporulation.
Note: if you kill spore objects (e.g. with ObjectJ pistol tool) , the Maps need to be re-created.
ObjectJ> Forget Manual Sporulation Times
Restores the synchronized Map to the state before manual adjustment, and sets in ObjectJ Results “Appear2” to same value as “Appear1”.
ObjectJ> Manually Adjust Sporulation Times
Before choosing this command, right-click on ImageJ’s “Point Tool”, then set (or clear with ‘alt’ key) a single or multiple point ROI. Set the point(s) at the border of two circular patches which should correspond to t=0. Then, “Manually Adjust” will shift each spore’s row to the desired position.
Note: in ObjectJ Results, there are two columns “Appear1” and “Appear2”. Manual change will alter “Appear2”.
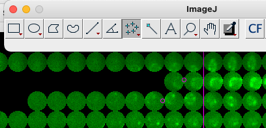
Zoom to Movie [Z]
This command must be invoked via shortcut key ‘Z’, while the cursor is on the desired patch in one of the Maps. Then the corresponding position, frame and channel is selected in the original movie. A segmented line shows the movement trajectory after spore appearance.
Previous Plot [1]
Selects the previous spore object and shows a plot of the 3 fluorescent channels vs time, where the sporulation time is defined as t=0. In the Map, this is indicated by a rectangular row. The number label of the selected spore is shown in the plot title.
Next Plot [2]
Similar to “Previous Plot”
Collective Plot [3]
For each time point relative to sporulation, the mean fluorescence is shown per channel. The number of involved spores is shown in the title.
Map shown in chn, and SyncMap in chn 2.
Three roi points are set, “Manually adjust sporulation time” will shift the corresponding rows towards the right by 1 and 2 steps, respecively.
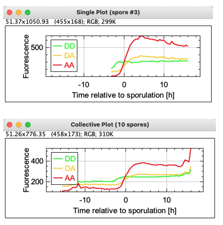
Single Plot and Collective Plot