Fig 1: first of 11 frames. Timestamp is shown as metadata (top)
Author: Norbert Vischer
Date: 29-Jun-2024
PlateReader is an ImageJ macro set that analyses the fluorescence response of small Arabidopsis leaves after a special treatment. The leaves are arranged in a 96-well plate, from which a time-lapse series is recorded as stack. Irregular time intervals are supported if each frame contains a timestamp as metadata like in the demo stack.
For addressing the leaves, 96 circles are positioned as overlay which is visible in all stack frames.
Inside each circle, parts whose intensity exceeds a user-defined threshold are considered to be part of that leaf. This can be visualised as a stack of "Isolated leaves" (green leaves on black background). Results are collected in TableA (see Figures below).
TableA is used to create plots (brightness vs time) and to create TableB, which in turn shows information per leaf like statistics and Flags.
Statistics:
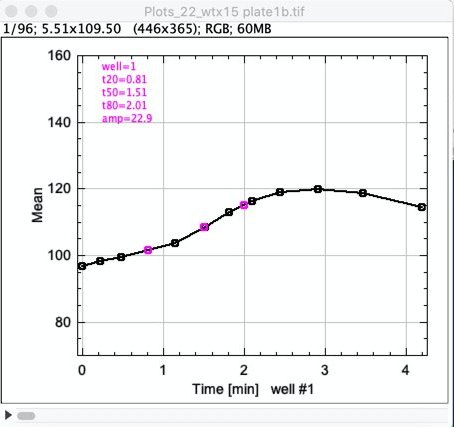
Between t=0 and the brightness peak, the following parameters are calculated and stored in TableB:
amp = yMax-yMin (amplitude)
t0 = time of minimum (before maximum)
t20 = time when 20% of the amplitude is reached
t50 = .. 50% ..
t80 = .. 80% ..
t100 = time of maximum
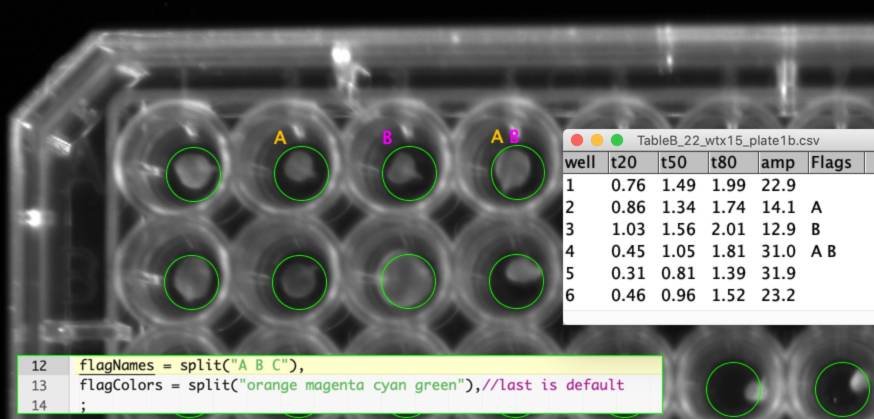
TableB supports an additional column called "Flags", used for single-character flags that are also shown in the plate image.

Fig 1: first of 11 frames. Timestamp is shown as metadata (top)

Fig 2: Enlarged

Fig 3: Stack of Isolated Leaves

Fig 4: TableA evaluates time stamps and records leaf brightness vs time.

Fig 5: Stack of 96 plots, showing plot of leaf#1

Fig 6: TableB (96 rows) shows statistics and user flags. Green circles are stored as overlay as part of the stack. Colored flags (A, B) are read from TableB and shown/hidden via the RoiManager.

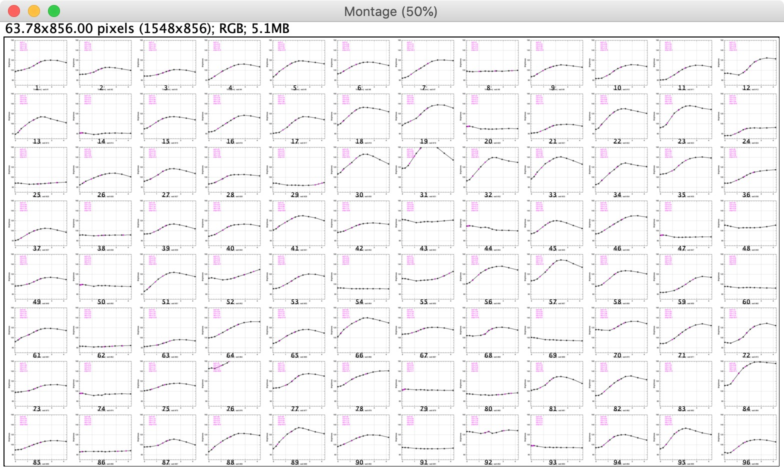
Fig 7: Montage of Plots as 12 x 8 matrix
This project was tested with the ImageJ application
In ImageJ, choose menu Plugins> Macros> Install... and install file "PlateReader_xx.txt", (or choose Macros> Install Macros when this file is already in front)
Under menu Plugins>Macros, the following commands appear:
    Suggest 4 Circles
    Create 96 Circles
    Define Threshold
    Calc Wells
    TableA-to-Plots
    Toggle Overlay
    Toggle Labels/Flags
    Show Isolated Leaves
    Show Plots
    Set/Clear Flag #1 [1]
    Set/Clear Flag #2 [2]
    Set/Clear Flag #3 [3]
    Change Flags... [0]
    Edit Flags in TableB
    Register Current Stack
    Show Related Files
Open demo-stack (here: 22_wtx15_plate1b.tif)
(8-bit tif with timestamp in metadata)
This demo stack already contains the 96-circles overlay, so you can skip the next 4 points and directly jump to Register Current Stack
Choose Plugins> Macros> Suggest 4 Circles
Four circles will appear as overlay.
Move each circle to the correct corner by dragging its label
Choose Plugins> Macros> Create 96 Circles
96 circles will appear as overlay.
Still, you can correct any of the 4 corner circles and choose again
Create 96 Circles: remaining 92 circles will be re-adjusted
Choose File>Save, which saves the stack together with overlay
Choose Plugins> Macros> Register Current Stack which means that tables and plots will be connected to this stack
Choose Plugins> Macros> Define Threshold
Image appears with red threshold, you are asked to adjust the threshold.
In this demo, drag sliders e.g. to low=70, high=255. Alternatively, change numbers in
their fields but activate Window "Threshold" before pressing "return"
Choose Plugins> Macros> Calc Wells
TableA will be created showing mean brightness per time interval and well.
Choose Plugins> Macros> TableA-to-Plots
From TableA, a stack of Plots is created: brightness vs time.
Additionally, TableB is created, containing following parameters per well: amp, t20, t50 and t80 (see introduction). TableB and Plots are saved in the folder of the time-lapse stack.
Choose optionally Plugins> Macros> Show Plots...
and select dynamic plots or montage of plots
Naming convention:
TableA, TableB and Plots inherit name and file location from the time-lapse stack. Switching to a different plate, you need to 'register' the plate stack.
Example:
Content File name Time-lapse stack MyStack.tifTableA TableA_MyStack.csvTableB TableB_MyStack.csvPlots Plots_MyStack.tif
Suggest 4 Circles
Four circles will appear as overlay
Create 96 Circles
96 circles will be derived from the corner circles. Still, you can correct any of the 4 corner circles and choose again Create 96 Circles: remaining 92 circles will be re-adjusted
Define Threshold
Image appears with red threshold, you are asked to adjust the threshold. In this demo, drag sliders e.g. to low=70, high=255. Alternatively, change numbers in their fields but activate Window "Threshold" before pressing "return"
Calc Wells
TableA will be created showing mean brightness per time interval and well.
TableA-to-Plots
From TableA, a stack of Plots is created: brightness vs time. Additionally, TableB is created, containing following parameters per well: amp, t0, t20, t50, t80 and t100 (see introduction). TableB and Plots are saved in the folder of the time-lapse stack. If previous TableB already contained flags, these will be restored in the new table.
Toggle Overlay
Shows/hides 96 circles
Toggle Labels/Flags
Shows either the numerical labels (1..96) or any existing flags
Show Isolated Leaves
Shows leaves (green) in a time-lapse stack. Pixels outside circles or below the threshold appear as black background.
Show Plots
Shows the non-dynamic stack of plots, with the option to show dynamic plots, or montage of 96 plots.
Set/Clear Flag #1 [1]
Position the cursor above one of the circles and press key '1'. In the top of the example macro, the first letter in 'flagNames' is 'A', which will appear above that leaf. It will use the first color in 'flagColors'. It alsow will appear under 'Flags' in TableB. Pressing '1' again, the flag will disappear. Changing a flag will automatically save TableB to disk.
Set/Clear Flag #2 [2]
Similar to previous
Set/Clear Flag #3 [3]
Similar to previous
Change Flags...[0]
You can apply any set of characters here, they need not to be defined in flagNames. Flag names are case-sensitive. No spaces are necessary between flag characters.
Edit Flags in TableB
shows TableB with the option to select a continuous range. The program will first clear and then set the flags indicated in the two dialog fields. No spaces are needed to separate the flags. This action will be applied to the defined range of rows in TableB.
Register Current Stack
makes sure that TableA, TableB, and Plots are (or will be) connected to the current stack. (It sets the global variables baseName and basePath).
Show Related Files
allows to show registered files Plate, TableA, TableB, or all. Or show them in their folder.
ImageJ Notes:
* Closing a table: no 'save changes' warning appears
* Opening table with same name: existing table is overwritten without warning
* Opening e.g image file "MyStack.tif" a second time while it was already open, it appears as MyStack-1.tif. To avoid confusion, the latter cannot be registered ("minus sign at end not permitted")
* Please use ImageJ 1.54j16 or later