| Author | Norbert Vischer |
| History | 10-nov-2013: First version |
| Source: | PeakFinderTool.txt |
| Description: | Intensity peaks along a straight line are shown as vertex handles |
| Features: |
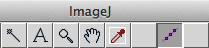
Select the PeakFinder Tool and drag a line across your image
Peak positions will be shown as vertices ('handles') of a segmented line
Show live profile as overlay while shift key is down
Add or delete manually a peak at cursor location via shortcut key for "Insert Peak [1]" or "Kill Peak [2]"
Examine an existing line selection via "Find Peaks [3]"
Observe profile and data by choosing "Show Marked Profile [4]"
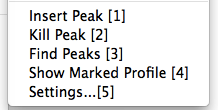
Menu commands
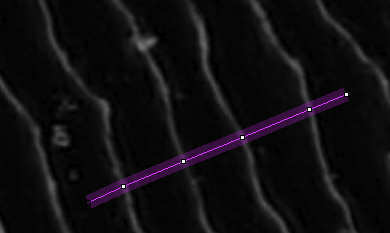
Live indication of peaks as 'handles'
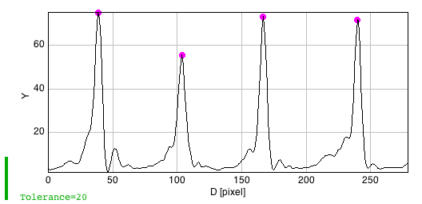
Annotated profile
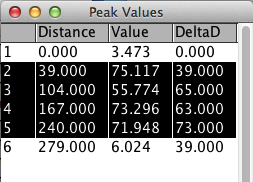
Data for begin point, 4 peaks, and end point
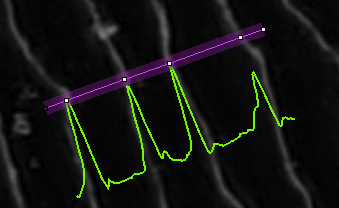
Live profile (green overlay) is shown while the shift key is down,
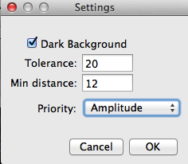
Tolerance: min. intensity difference to separate peaks
Min Distance: suppress neighbors closer than Min. Distance (pixels).
Priority = Amplitude: when suppressing neighbors, highest peak will win
Priority = Left: when suppressing neighbors, leftmost peak will win
Priority = Right: when suppressing neighbors, rightmost peak will win
Terms 'left' and 'right' refer to profile plot, or to a line drawn from left to right.