03.06.22, 13:20
Norbert Vischer
Steady-state of a bacterial cell population can be achieved by keeping the suspension's volume and cell concentration constant, while allowing exponential growth. To limit the cell concentration, a part of the suspension is periodically replaced by fresh medium. After changing growth conditions, it takes a number of generations until the culture reaches a new steady-state.
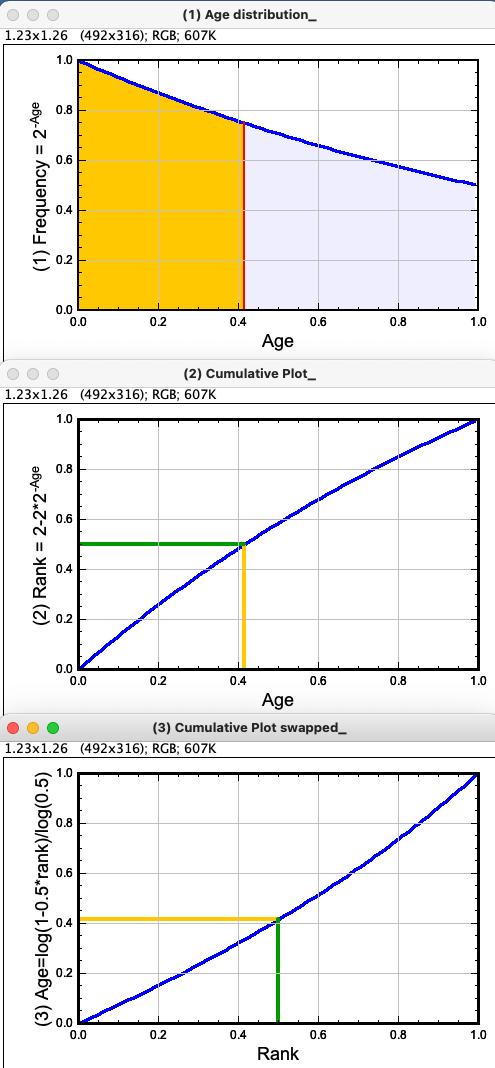
Fig (1)
Age distribution of a steady-state population:
oldest cells appear with half frequency of youngest cells (exponential relationship).
Red line (median, age = 0.415) divides population into two equal areas. The orange area represents the younger half of all cells.
Fig (2)
Cumulative plot, derived by integrating Eq 1 and assuming population size=1.
It shows relation of rank vs age.
The rank of a cell is its position within a list which is sorted (e.g. for length), where 0<= rank <= 1.
The median cell has rank = 0.5.
Length of the orange line corresponds to relative orange area in Fig(1), i.e. 0.5.
Equation (2) allows to convert age into rank.
Fig (3)
For converting rank into age, equation (3) is obtained by solving equation (2) for age. Axes x and y are swapped.
Equation (3) allows to convert rank into age.
Equations:
(Eq 1) Frequency = 2^-Age
(Eq 2) Rank = 2-2*2^-Age
(Eq 3) Age = log(1-0.5*Rank)/log(0.5)
log is natural logarithm
The three plots were created with this ImageJ Macro