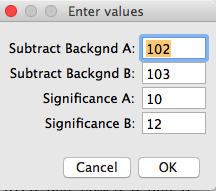
Fig 1: User values for background and significance
(see suggestion [a] below)
N.Vischer
10-jun-2016
This ImageJ macro visualizes the different fluorescence distribution on two images using the equation:
output = (A-B)/(A+B)
The result is shown using a color LUT red-white-blue.
- Red: image B dominates
- White: neutral
- Blue: image A domiates
Make sure that only two images were opened in correct order A-B (see Window menu)
Install macro CalculateGP02.txt
Choose menu Plugins>Macro>Calculate GP
**The following actions are performed: **
in image B, non-significant pixels (demo value: <= 12) are set to zero
(non-significant pixels are considered to be not part of the cell)
image "A-B" is calculated as 32 bit
image "A+B" is calculated as 32 bit
image "Ratio" is calculated from (A-B)/(A+B) as 32 bit
in image "Ratio", all values <= -1 and >= 1 are set to NaN (not a number) Such a pixel has been zero in one or both channels after background and and significance process
a lookup table is created with gradient red-white-blue corresponding to indices 0-128-255. However, both end points are set to black.
min and max display values are set to -1 to 1. This means that the lookup table is applied symmetrically, e.g.
-0.99 = red
0 = white
0.99 = blue
you can change this range by choosing menu Image>Adjust> Brightness&Contrast, then click on "Set" and change the values (don't click Apply).
alternatively, do this via macro command: the macro "Set LUT example" applies an asymmetric range -0.4 to 0.8, i.e. 0.2 appears white
For viewing purposes, you can duplicate the scientific 32bit image and convert it to RGB via menu Image>Type>RGBcolor
Fig 1: User values for background and significance
(see suggestion [a] below)
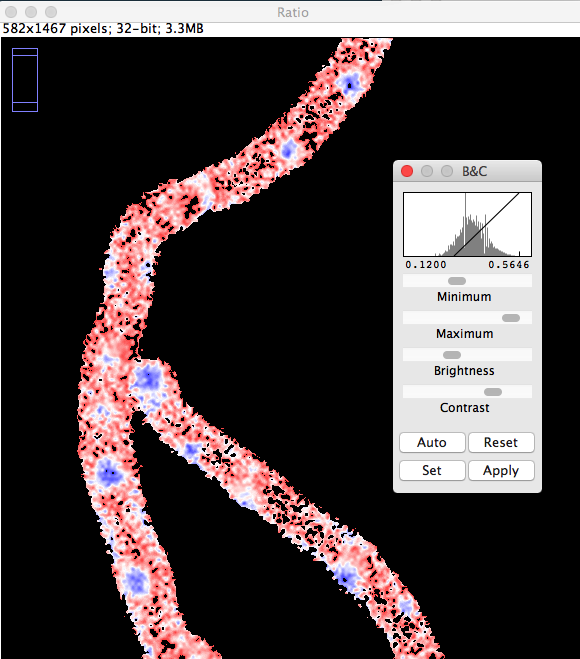
Fig 2: Change sliders Min and Max of Display Range via Image>Adjust>Brightess/Contrast
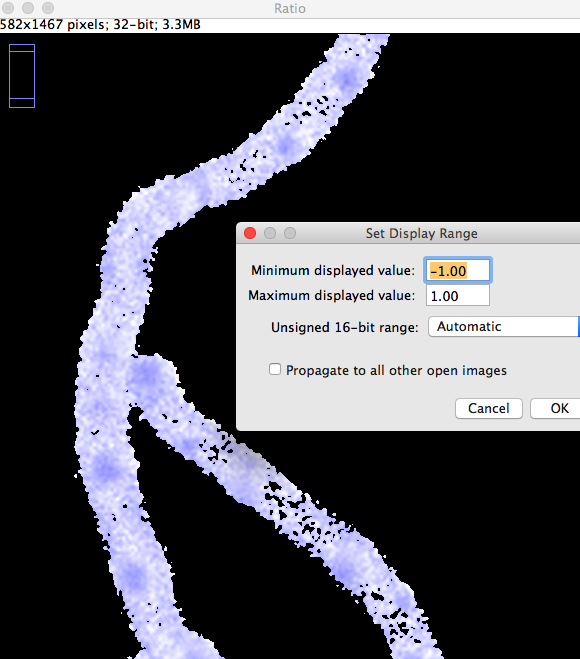
Fig 3: Change number fields Min and Max of Display Range
[a] Suggestion for background subtraction and significance:
In either of the two images, you could choose
- menu Edit>Select None
- menu Analyze>Histogram
and look at the values Mode and Max.
Choose:
- "Mode" for background subtraction, and
- "Max"/10 for significance.